
Module II
Data Analysis
About this module
In today's data-driven world, artificial intelligence (AI) has emerged as a transformative force, revolutionizing industries, improving and shortening decision-making processes, and shaping the way we interact with technology. One of the main advantages of AI is its ability to process and extract valuable insights from vast amounts of data. This course serves as your gateway into the exciting and dynamic field of data analysis within AI.
Learning outcomes
In this lesson we will take a look at data analysis, one of the crucial abilities of Artificial Intelligence. After finishing the lesson, you will be able to:
- Understand key concepts such as data types, data sources, and data interpretation. You'll learn how to obtain, clean, and organize data effectively
- Know the statistical techniques and tools that are essential for data analysis, including measures of tendency, variability, and probability
- Discover the statistical techniques for AI, how to create visualizations, perform data profiling, and uncover patterns and anomalies in your datasets
- Learn about real-world applications of data analysis in AI across various industries
How you'll learn
During the lesson you must read the written explanations and follow the given instructions at interactive elements. To achieve the designated learning outcomes we support you by providing essential content for the learning process, such as tutorial videos and interactive tests.
Data Analysis – data interpretation and visualization.
You are a participant in an e-learning course about data types, interpretation, and visualization of data. The course is designed to be interactive and engaging, allowing you to apply what you've learned in real-world scenarios. In one of such scenarios, you have to analyze customer behavior for an e-commerce platform. To achieve this, you need to analyze customer behavior data. In this scenario, you'll apply your knowledge of data types, interpretation, and visualization to tackle a real business problem. Before going into analysis, please check the image and link below to learn about basic data types in databases.
Source:
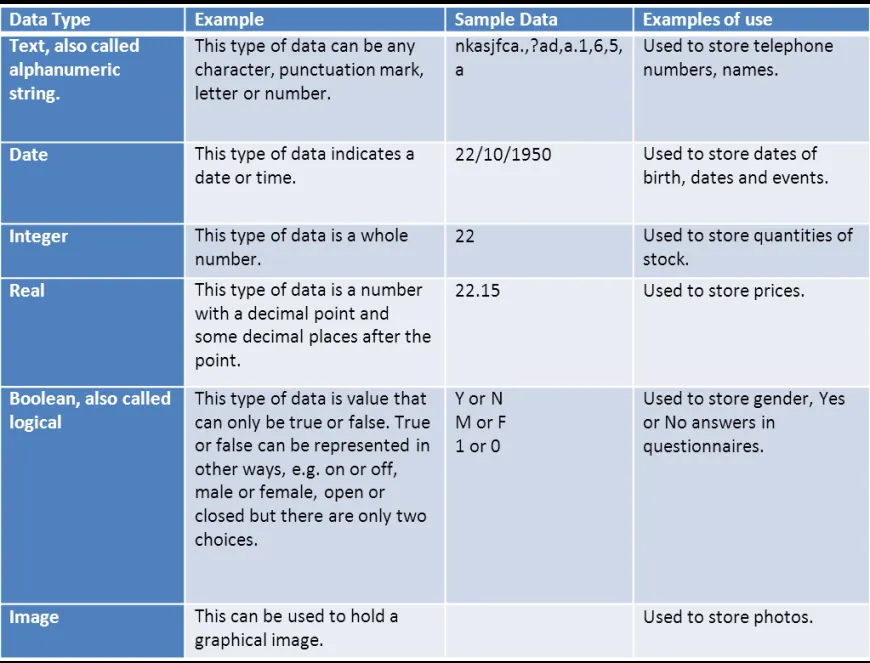

Firstly, you need to identify different data types present in this example of a simple dataset below:
CustomerID Date Location ProductID Action Amount 1 2023-09-01 New York P001 Viewed 2 2023-09-01 Los Angeles P002 Viewed 3 2023-09-01 Chicago P003 Purchased 55.99 4 2023-09-02 San Francisco P001 Viewed 5 2023-09-02 Chicago P004 Viewed 6 2023-09-03 New York P002 Purchased 39.99 7 2023-09-03 Los Angeles P001 Viewed 8 2023-09-03 Chicago P005 Viewed 9 2023-09-04 New York P003 Purchased 55.99 10 2023-09-04 San Francisco P002 Viewed Each header in the table stands for:
- CustomerID: A unique identifier for each customer.
- Date: The date of the interaction.
- Location: The location where the interaction took place.
- ProductID: The ID of the product the customer interacted with.
- Action: The type of action the customer performed (e.g., "Viewed" or "Purchased").
- Amount: The amount spent by the customer if the action was a purchase, or a placeholder (-) if it was a view. In a real-world scenario though, the dataset would be much more complex, with more data types and features, such as those described in the video. Click the link below to learn about a variety of more complex data types, which can be used depending on text length, value of a number etc.
Check your knowledge about data types. Which one should be used in each situation? Let’s get started!
Please press Ctrl + click the image to start the quiz.
Now when you understand the data types, it's time to interpret the data to extract meaningful insights. Using AI tools and techniques, you can enhance your data interpretation and visualization capabilities. It can significantly improve your ability to extract insights from large and complex datasets. Here's a step-by-step guide on how to leverage AI for this purpose:
- Getting data ready: Start by collecting and cleaning your data. Make sure it's well-organized and doesn't have mistakes, wrong information or missing elements.
- Picking the right AI tool: Choose the correct AI computer program for your task. It could be something like a smart calculator or a language understanding program, depending on what you want to do. The most well-known example of such AI tools is ChatGPT.
- Teaching the AI: Train your chosen AI program using examples with known answers. Adjust its settings to make it work better.
- Understanding the AI's work: Look at what the AI does. It might show you which sections of your data are more important or provide predictions.
- Creating images and visualizations: Create pictures or graphs to show what the AI has found. This can help you see patterns or trends in your data.
- Explaining how it works: Try to understand how the AI makes its decisions. Some tools can tell you which parts of your data are most important, you just need to use a correct prompt for AI tool to understand you!
- Checking its work: Test how well the AI is doing by comparing its results to what you already know. If it's not doing well, you might need to change something. By simply following these steps, you can use AI to help you understand data, even if you're just a beginner. To help you comprehend it even better, here is a video which shows you the potential of using ChatGPT in data analysis.

Best free AI tool for data Analysis 📊 || Quantitative data and AI tool | ChatGPT for Research | ai Brief introduction of the next block:
In the next chapter you will learn about Statistical Techniques for AI
Data Analysis – Statistical Techniques for AI
Imagine you work for an e-commerce company and you have to do customer behavior analysis in order to improve customer experiences and increase sales. To analyse customer behavior data, you will have to apply statistical techniques using Artificial Intelligence.
This course will help you develop practical skills for using statistical methods to extract insights and make data-driven decisions in an e-commerce setting.
Here are the most crucial steps how to implement statistical techniques using AI:
- Clearly state your problem and desired insights.
- Collect and clean data from diverse sources.
- Use advanced EDA (Explanatory Data Analysis) techniques and visualizations.
- Select advanced AI models suitable for your problem (like deep learning or specialized models).
- Optimize model hyperparameters (for example: grid search or Bayesian optimization).
- Implement cross-validation to assess your model's robustness and generalization ability.
- Use domain-specific metrics for evaluation.
- Use advanced interpretation techniques like SHAP (SHapley Additive exPlanations) values.
- Create a compelling data story to highlight key findings and their relevance to defined problem.
10.Develop interactive visualizations and dashboards to document your analysis.
By following these steps, you can perform a comprehensive analysis using AI statistical techniques at intermediate level, allowing for in-depth insights and informed decision-making.
To see an example of using an AI model in action in order to solve basic statistical problems, see this short video:
ChatGPT in action: Solving stats problems with the help of artificial intelligence
Earlier, we mentioned some advanced techniques like SHAP or EDA. But what do they do or how can you actually use them? Here is the explanation as well as some more advanced AI statistical analysis techniques you can utilize:
- SHAP (SHapley Additive exPlanations):
- What is SHAP: SHAP values are a method for interpreting complex machine learning models by attributing a prediction's outcome to individual features. They help explain the "why" behind model predictions. How to Use SHAP:
- Calculate SHAP values for a specific prediction to understand feature contributions.
- Visualize SHAP summary plots or individual instance explanations.
- Interpret positive and negative SHAP values as feature importance.
- Use SHAP values to make informed decisions or provide model explanations.
- EDA (Exploratory Data Analysis):
- What is EDA: EDA is the process of summarizing, visualizing, and exploring data to understand its key characteristics, patterns, and relationships. How to Use EDA:
- Create basic visualizations like histograms, scatter plots, and box plots.
- Calculate summary statistics (mean, median, standard deviation).
- Identify outliers and anomalies in the data.
- Formulate hypotheses about data patterns and relationships, then test them.
- Ensemble Learning:
- What is Ensemble Learning: Ensemble methods combine multiple machine learning models to improve predictive accuracy and robustness. Common techniques include bagging (e.g., Random Forests) and boosting (e.g., AdaBoost, Gradient Boosting). How to Use Ensemble Learning:
- Select a base model (e.g., decision trees).
- Create an ensemble by combining multiple instances of the base model.
- Bagging: Train each instance on a random subset of the data.
- Boosting: Sequentially train models, giving more weight to misclassified data.
- Use the ensemble for predictions, often achieving better performance than individual models.
- AutoML (Automated Machine Learning):
- What is AutoML: AutoML refers to the automation of the end-to-end machine learning process, including data preprocessing, feature engineering, model selection, and hyperparameter tuning. How to Use AutoML:
- Choose an AutoML platform or library (e.g., Google AutoML, H2O.ai).
- Provide your dataset and specify the target variable.
- AutoML tools automatically handle data preprocessing, model selection, and hyperparameter optimization.
- Evaluate the best-performing model(s) and deploy them for predictions. These techniques enhance the capabilities of data analysis and machine learning by providing tools for model interpretability (SHAP), data exploration (EDA), improved prediction accuracy (Ensemble Learning), and automation of the entire modeling process (AutoML). Depending on your specific analysis needs, you can incorporate these techniques into your workflow to gain deeper insights and make more informed decisions.
If you need further explanation and want to see some examples of implementation of these techniques, here are a few useful video tutorials:
- Explainable AI: Intro to SHAP
- All Machine Learning Models Explained in 5 Minutes | Types of ML Models Basics
Before finishing Block 2, you need to measure the knowledge you have gained. Here is a short quiz which considers the aspects of implementing statistical techniques for Artificial Intelligence.
Press Ctrl + click the image to begin the quiz.
Main take-aways:
- Master data collection, cleaning, and preprocessing for high-quality analysis.
- Uncover data patterns and insights through effective exploratory data analysis (EDA).
- Learn to summarize data, test hypotheses, and visualize findings using advanced statistical techniques.
End of module
Module complete
Continue when you're ready.